
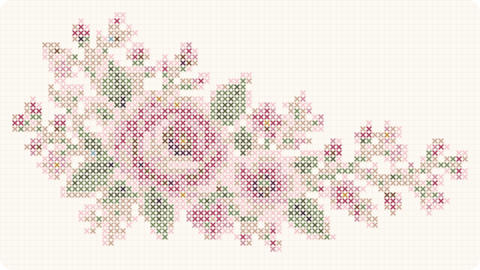
Cross stitch charts can be presented in color, black-and-white symbols or a combination of both. No format is automatically best: each solves a different problem. Color helps visual orientation, while symbols provide precision when two shades look almost identical.
A strong PDF prioritizes readability and, when practical, gives the stitcher more than one option.
Advantages of color charts
They make blocks easy to recognize at a glance and help you understand the overall image quickly.
On limited palettes with clearly different shades, they can feel very intuitive.
They also make it easy to locate an area when you know which color you are working.
The disadvantage is that screens and home printers can shift color significantly.
Why symbols still matter
Two neighboring DMC shades may look almost identical on a household printout.
A circle and triangle remain different even when the ink changes.
Symbols also allow the chart to work in black and white without losing information.
On projects with many colors, careful symbol selection reduces confusion.
Combined charts: color plus symbol
This format provides two references at once.
The colored background helps orientation while the symbol confirms the exact floss reference.
It can look visually busy when the grid is printed very small.
That makes scale and layout quality important.
Which format works best on paper?
If you want to save ink, black and white is the most efficient.
Check that similar symbols remain distinguishable after printing.
A color version can still be useful as an overview even when you stitch from the monochrome chart.
Print one test page when the symbols are dense.
Which format works best on a tablet?
On a screen, color has no ink cost and can improve navigation.
You can zoom far more than on paper.
Symbols remain useful when screen brightness or night mode changes color perception.
A combined version works especially well when the viewer supports sufficient zoom.
What should a good PDF chart provide?
A clear key connecting symbol, color and floss reference.
Symbols distinct enough from one another within the same area.
Resolution that stays sharp when enlarged.
If color and monochrome versions are included, both should represent exactly the same grid.
Color and symbols do not compete; they complement each other. Color helps you navigate while the symbol confirms which floss belongs in each square. On a complex chart, having both references reduces dependence on printers, screens and individual color perception.
If a chart uses color only and contains many similar shades, inspect a sample before buying. The page may look attractive, but the primary job of a working chart is making sure no square is ambiguous.
Color and symbols solve different problems. Color gives a fast visual impression of blocks and can make a chart feel closer to the finished image; symbols provide exact identification when shades are similar or when the chart is printed without color. For anything beyond a very small palette, combining both usually offers the strongest working format because one layer supports orientation and the other removes ambiguity.
Symbol design matters as much as symbol count. A circle, filled circle and tiny ring may be technically different but too easy to confuse at normal print size. Pattern review should test the chart at realistic zoom, not only on a large monitor. Neighboring colors deserve especially distinct icons because those are the places where a mistaken symbol can continue for dozens of stitches before being noticed.
Accessibility also argues for redundancy. Not every stitcher perceives color differences in the same way, and home printers may alter or remove color entirely. A color-only key can therefore fail even when the original designer sees every shade perfectly. Using symbols, references and color together lets the chart communicate the same information through more than one cue.
Different versions can be useful without changing the underlying pattern. A PDF may include a black-and-white symbol chart for printing and a color-plus-symbol version for tablets. Both should use identical page breaks, grid coordinates and stitch positions so progress can move between them. We want our PDFs to offer alternate views only when those views stay synchronized and genuinely improve usability.
A chart sample is valuable before purchase because it reveals this working quality better than a finished mockup. Customers should be able to see symbol size, grid weight and the density of a representative section. The attractive final image tells you what you are making; the sample tells you whether the document is comfortable to stitch from. Both are part of a trustworthy pattern.